
According to the April 3, 2015 Bureau of Labor Statistics survey:
“Total nonfarm payroll employment rose by 126,000 in March, and the unemployment rate remained unchanged at 5.5 percent, the U.S. Bureau of Labor Statistics reported today. Employment continued to trend up in professional and business services, health care, and retail trade, while mining lost jobs.”
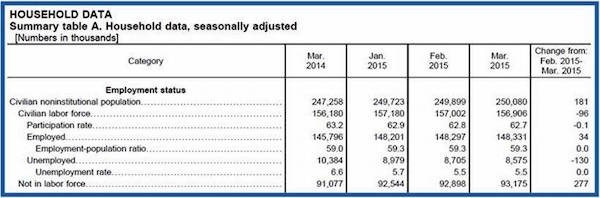
This time around, we’ll take a different tack in walking through the data in the Household Data Summary Table A. Household data, seasonally adjusted.
First…here’s a short explanation on the terms from the Summary
The Civilian Noninstitutional Population (CNP) includes those 16+ years of age, not counted in institutions (military, prison, otherwise institutionalized)
[Civilian] Labor Force includes those Employed + those Unemployed, actively seeking employment
Labor Force Participation Rate (LFPR) is equal to the Labor Force (Employed + Unemployed) divided by the Civilian Noninstitutional Population
Employment-Population Ratio is equal to those Employed divided by the Civilian Noninstitutional Population
(U3) Unemployment Rate is equal to those Unemployed (actively seeking employment) divided by the Labor Force
Not in the Labor Force is equal to the Civilian Noninstitutional Population less those counted in the Civilian Labor Force.
Digging into the Employment Situation in the Household Survey
While the data shown in the Current Population (Household) Survey is pretty straightforward, the relationships can become a bit confusing. Again, we will be taking a slightly different tack in going through the numbers.
First, the Civilian Noninstitutional Population (CNP) includes all of those people either entering the 16+ age group for the first time, or those re-entering after having been in some not-included institution (leaving military, released from prison, etc.). This number has typically been in the 175,000 to 220,000 range on any given month. For the month of March 2015, 181,000 people were added to the CNP. Likewise, from March 2014 through March 2015, the average monthly increase was 217,000.
When we tally the [Civilian] Labor Force we simply take the Employed and then add the Unemployed. On a monthly basis or year over year, we simply take the most recent data and subtract the previous data point.
For the month of March 2015, 34,000 people were added to the Employed. Likewise, from March 2014 through March 2015, the average monthly increase was 195,000.
For the month of March 2015, 130,000 people left the ranks of the Unemployed. From March 2014 through March 2015, the average monthly decrease was 139,000.
In combining the two segments (Employed + Unemployed), we end up with a Labor Force change of -96,000 for March 2015 (34,000 Employed + (130,000) Unemployed). For the period March 2014 – March 2015 we had an average monthly Labor Force change of 56,000 (195,000 Employed + (negative) 139,000 Unemployed).
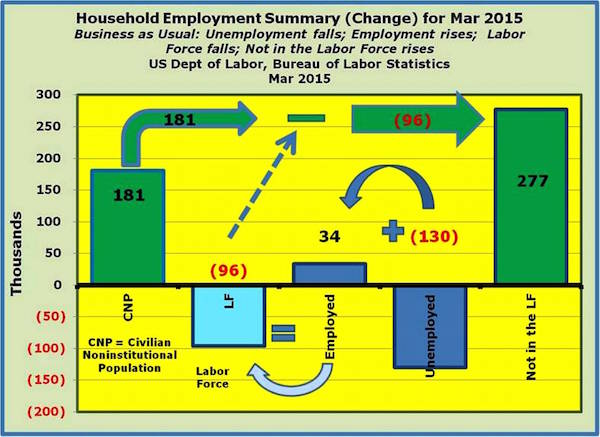
Month of March 2015 Change from February 2015
In summary, there was an increase in March of 181,000 in the CNP, an increase in employment of 34,000, and a reduction in unemployed of 130,000, leaving us with a -96,000 change in the Labor Force [+34,000 employed + (negative) 130,000 = -96,000]. The final step in arriving at the net change in the Not in the Labor Force is to take the 181,000 CNP and subtract the -96,000 in the Labor force, leaving us with an increase in the Not in the Labor Force of 277,000.
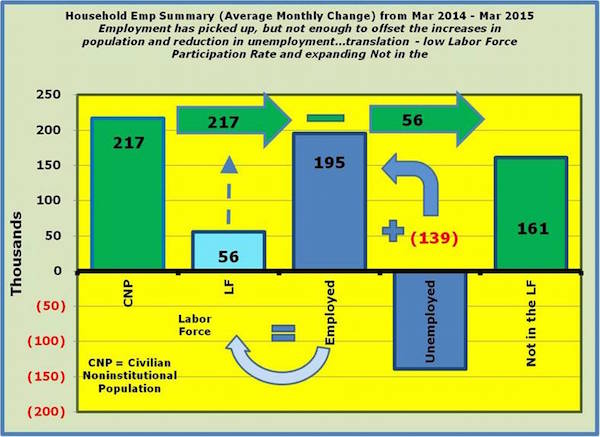
Average Monthly Change from March 2014 through March 2015
There was an average monthly increase in March 2014 – March 2015 time frame of 217,000 in the CNP, an increase in employment of 195,000, and a reduction in unemployed of 139,000, leaving us with an average 56,000 monthly change in the Labor Force. The net change in the Not in the Labor Force is to take the 217,000 CNP monthly average and subtract the 56,000 in the Labor force, thus leaving us with an average monthly increase in the Not in the Labor Force of 161,000.
Employment-Population Ratio and the Labor Force Participation Rate
Lastly, let’s take a look at the Employment-Population Ratio and the Labor Force Participation Rate, first with the monthly change from February 2015 –March 2015, and then the average change from March 2014 through March 2015.
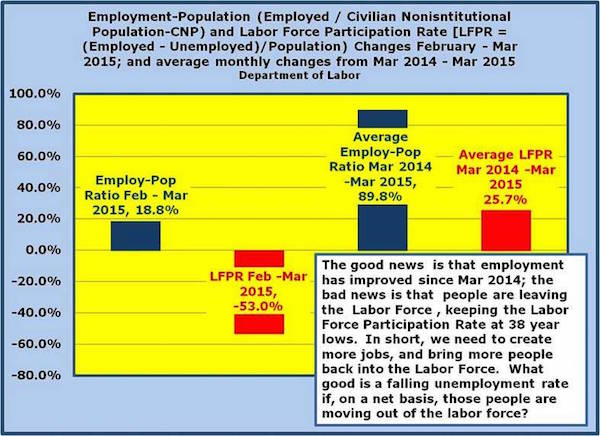
Monthly Change in Employment Population Ratio and Labor Force Participation Rate February 2015 – March 2015
The Employment-Population Ratio is simply the Employed divided by the Civilian Noninstitutional Population. For March 2015, the change in employment from February 2015 was 34,000 and the Civilian Noninstitutional Population grew by 181,000, resulting in an 18.8% Employment-Population Ratio. The current Total Employment-Population Ratio is 59.3 and the average rate since 2000 is 61.2%.
The Labor Force Participation is the Labor Force (Employed + Unemployed) divided by the Civilian Noninstitutional Population. For March 2015, the change in the Labor Force from February 2015 was -96,000 and the Civilian Noninstitutional Population grew by 181,000, resulting in an -53.0% Labor Force Participation Rate. The current Total Labor Force Participation Rate is 62.7% and the average rate since 2000 is 65.4%
Average Monthly Change in Employment Population Ratio and Labor Force Participation Rate March 2014 – March 2015
The change in employment from March 2014 through March 2015 averaged 195,000 on a monthly basis and the Civilian Noninstitutional Population grew by 217,000, resulting in a very robust 89.8% Employment-Population Ratio. Again, the current Total Employment-Population Ratio is 59.3 and the average rate since 2000 is 61.2%.
The change in the Labor Force from March 2014 through March 2015 averaged 56,000 on a monthly basis and the Civilian Noninstitutional Population grew by 217,000, resulting in a very anemic 25.7% Labor Force Participation Rate. The current Total Labor Force Participation Rate is 62.7% and the average rate since 2000 is 65.4%
The takeaway from this last Employment Situation Report is that we are still struggling mightily on the jobs front, in spite of what at times seems like robust expansion in employment of 200,000 per month. At the end of the day, we need to be seeing on the order of 300,000 jobs per month to offset the additions in terms of population and subtractions from the ranks of the unemployed moving to the employed.
Always keep in mind that we are looking at net movements on a monthly basis
So what’s a good month on the Household Survey Side?
1) Population +200,000; Labor Force + 150,000 (Employed +300,000; Unemployed -150,000); Not in the Labor Force -50,000
2) Population +200,000; Labor Force + 450,000 (Employed +300,000; Unemployed +150,000); Not in the Labor Force -250,000
Yep, even with an uptick in Unemployment, so long as Employment is rising this is not a bad thing. In fact, rising unemployment is often indicative of an ‘encouraged worker effect’ where people move out of the ‘Not in the Labor Force’ component hoping to find work.